Business Agenda:
In the competitive space of music, everyone is trying to figure out what the next hit is going to be. Getting ahead of the curve allows executives to make informed business decisions based on what they believe will be profitable. Utilizing aspects of songs such as their beats per minute, the artist, duration and other factors, I have created a machine leaning solution for predicting how popular a particular song based on the aspects of the songs.
Overview: Project relating to the data sets containing songs from Spotify
- Utilized data sets available on Kaggle. One for Visualizations and Larger one for training the model.
- Checked and ensured the validity of the Data
- Performed Exploratory Data Analysis on the Data
- Created a Number of Models
- Packaged Light GBM Model and Pushed into Production
Data Cleaning and Visualization:After gathering the data I ran the Exploratory Data Analysis on it and produced the following visualizations:
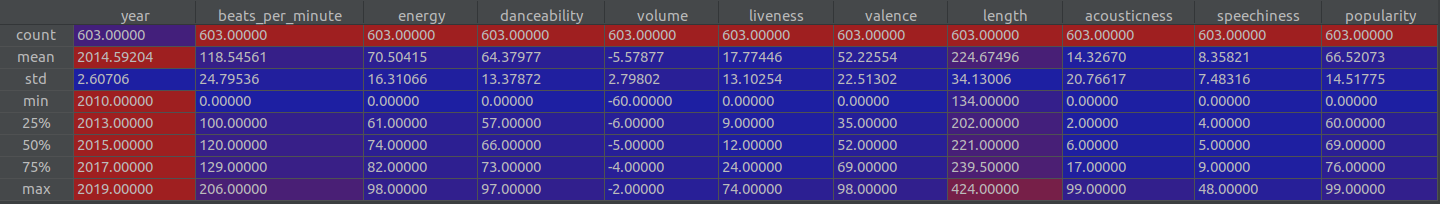 Here we can see some information about the different variables. We see that the data set contains songs from 2010 to 2019. That the shortest song is 134 seconds, while the longest is 424 seconds.
Also of note is that popularity ratings range from 0 to 99 but have a average rating of 66.
Here we can see some information about the different variables. We see that the data set contains songs from 2010 to 2019. That the shortest song is 134 seconds, while the longest is 424 seconds.
Also of note is that popularity ratings range from 0 to 99 but have a average rating of 66.
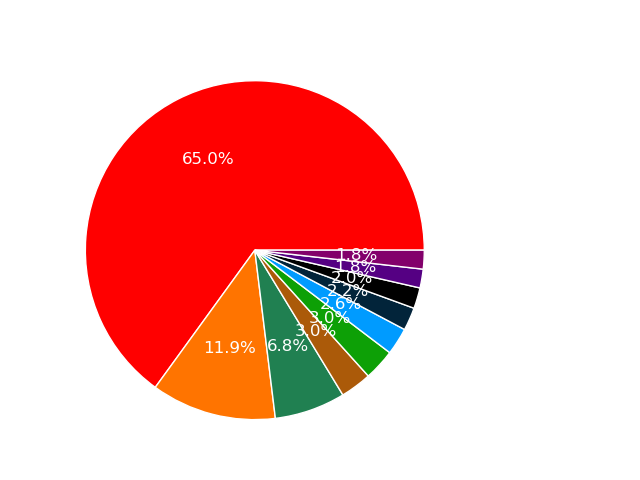
This distribution of Genres is interesting. The most popular song genre is dance pop followed by pop.
In fact a majority of the top genres are variations of pop.
This data set is not very well balanced. A majority of the songs are dance pop.
Therefore to train a model we should use a larger data set that would contain more songs and a number of different genres.
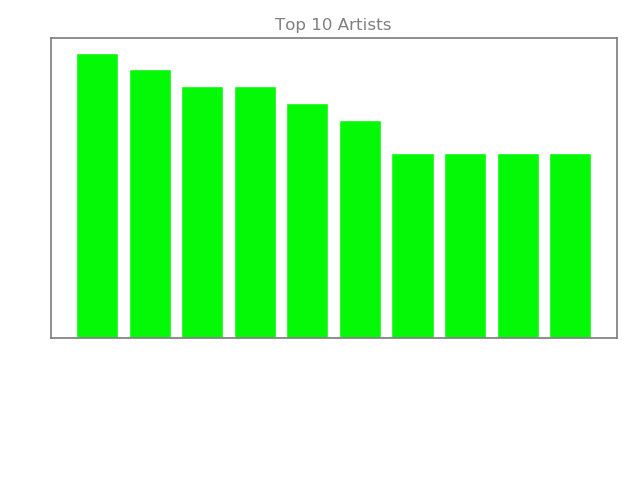
From this chart we see that Katy Perry leads the way in terms of popular artists in number of songs on the list.
Justin Bieber is second while Rihanna rounds out the top three.
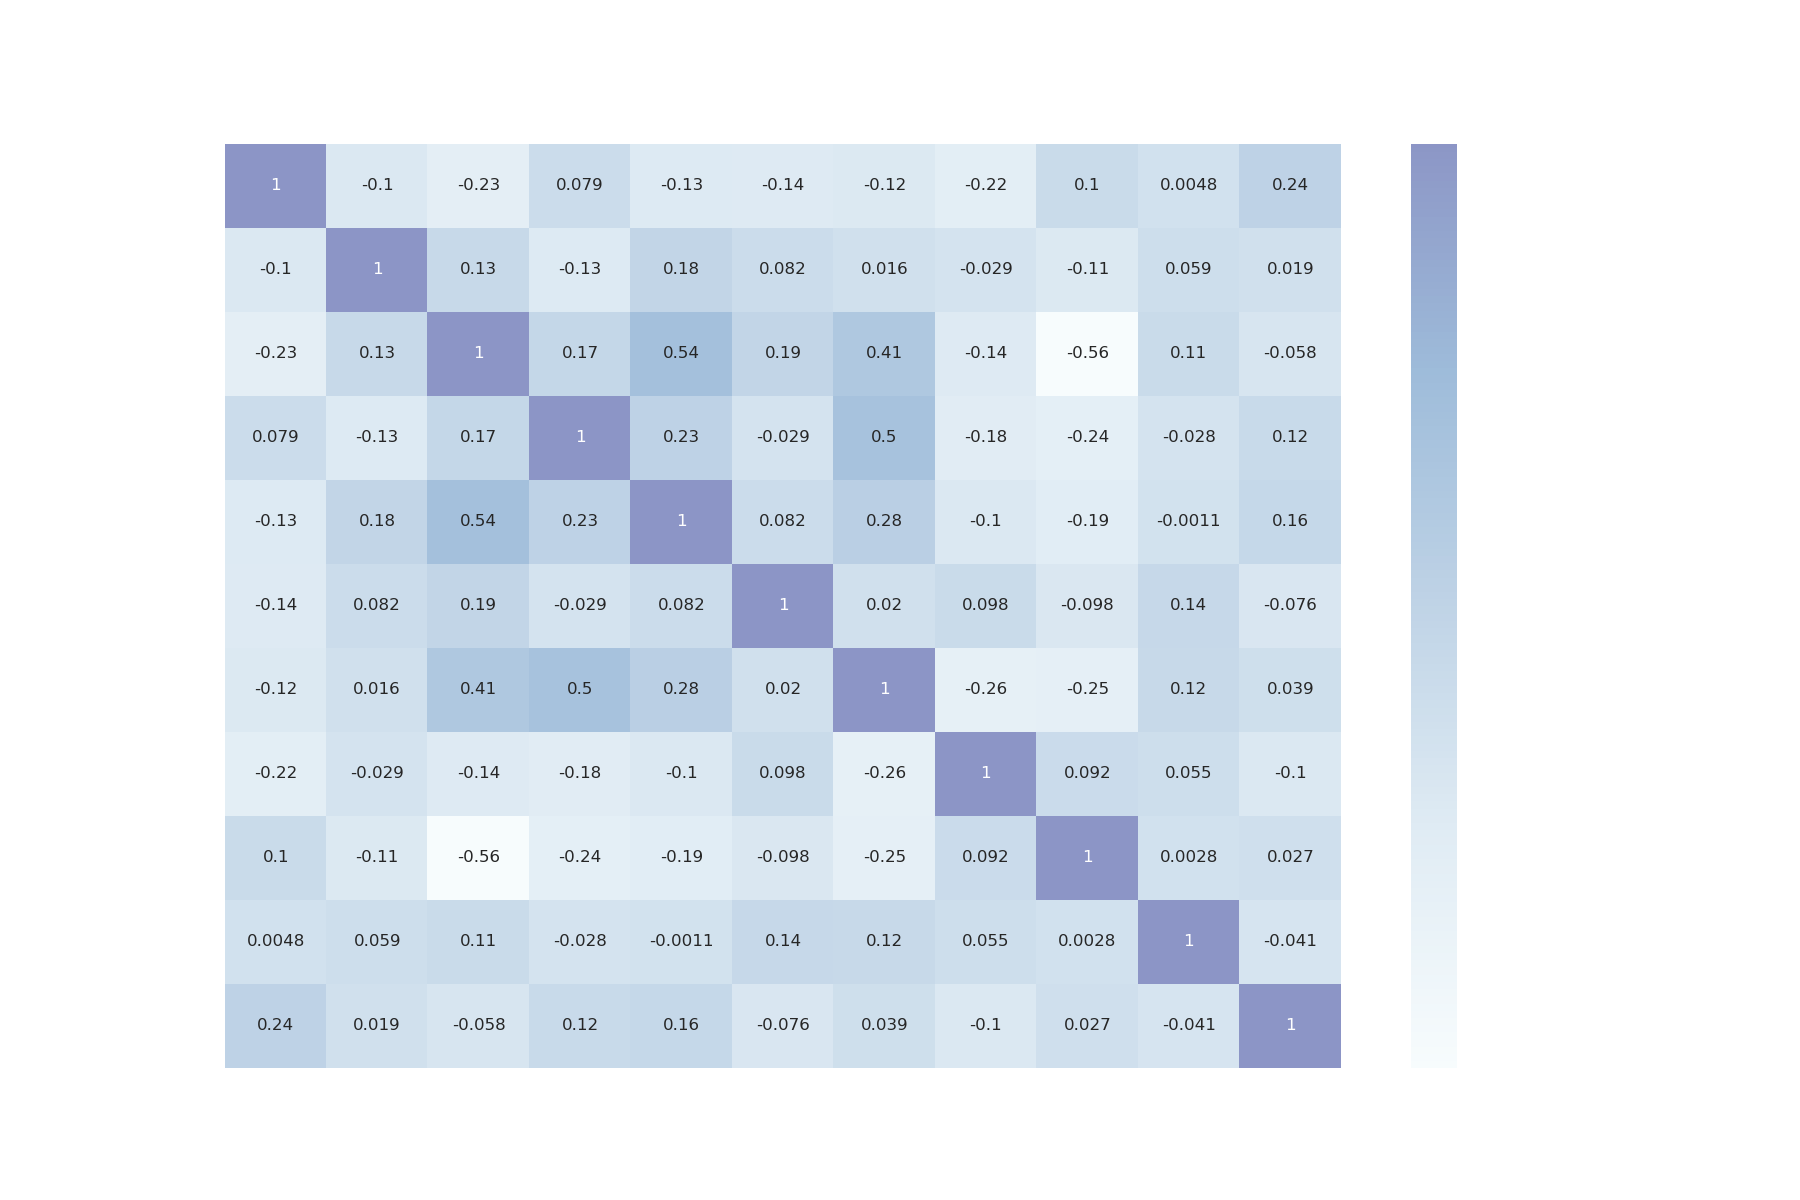 Heatmap provides us with data on the correlation between different variables.
Danceability of Songs Broken out by Year: [Double click on a year in the legend to only see that year] [Single click to remove from view]
Popularity of Songs broken out by year: [Double click on a year in the legend to only see that year] [Single click to remove from view]
Songs From 2016:
Model Building:Created the following models: Multi Variable Linear Regression, Gradient Boosting, Decision Tree, Random Forest and LightGBM Models to predict popularity given the other features of the data.
Model Performance:The LightGBM Model proved the most efficient. Therefore chose to package the LightGBM for production due to lighter computing speed. Loss function: MAE
- Multi Variable Linear Regression : 12.96
- Gradient Boosting: 9.82
- Decision Tree: 11.47
- Random Forest: 8.55
- Light GBM: 8.22
- Category: Data Visualization and Regression
- Date: July 2020
- Github: View on Github